
What is Supertrend Indicator?
Faster and simpler is today’s mantra and that is what supertrend indicator stands for. Being an intraday trader, it is difficult to stay aloof from the use of indicators. While there are numerous indicators available for quick technical analysis of the trades, here we will discuss the supertrend indicator. It is an indicator quite similar to Moving Average Convergence Divergence or MACD. If you are already using other indicators, it is quite simple to follow this one.
Supretrend indicator is created by Olivier Seban to work on different time frames. It works for futures, forex, and equities. It is used in 15 minutes, hourly, weekly, and daily charts. Based on the parameters of multiplier and period, the indicator uses 3 for multiplier and 10 for ATR as default values. The average True Range is represented by the number of days while the multiplier is the value by which the range is multiplied.
How to Use Supertrend Indicator?
To use this Supertrend, you need to follow these steps:
- Open the chart of a particular stock you want to trade.
- Fix the time interval of 10 minutes for the intraday trading. For that, you can use any good charting software.
- Insert the supertrend as your indicator. With this, you can also set as 10 & 3 and it is possible to insert your own setting as well.
- Now start tracking when the signals are in your favor.
- You can also follow the arrows for the signals to buy and sell the stocks.
Using Supertrend, you can also analyze the stocks technically. In fact, it gives signals to go for long or short on confirmation of the trend.
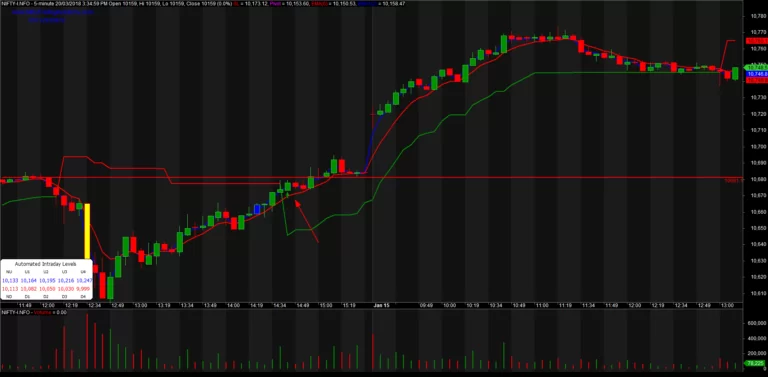
In order to use the indicator, open the chart of a particular stock you want to track and set a time interval of 10 minutes for intraday trading. Any good charting software can be used. Insert supertrend as your indicator and keep the settings as 10 and 3. It is possible to insert your own settings as well. Now start tracking when the signals are in your favour. Once you plot the indicator, you will find pictures as shown in the charts here. Follow the arrows for the signals to buy and sell the stocks.

However, while you use this, better not avoid to put your stop loss. While aiming for a long position, you can put your stop loss right at the green indicator line. In another case, you can put it at the red indicator line. Using supertrend along with your implementing your stop loss pattern is the best way to earn the best wealth in trading.
The basic motive of the indicator is to give buy sell signal to the traders. It shows the change in trends by turning its flips. When the price of the stock goes high than the indicator value, the indicator gives the signal by turning the colour to green.
Vice versa, when the price goes down than the indicator value, a sell signal occurs. It is shown as the color changes to red. The indicator quickly captures the short intraday trends. However, the default values of 10 and 3 are good while you use it. In an attempt to reduce the parameter, you might end up generating wrong signals.
Pros and Cons of Supertrend Indicator
As per many experts, supertrend indicator is best to use in combination with other indicators like MACD and RSI. However, let us see what are its own advantages and disadvantages.
The best thing about supertrend it sends out accurate signals at a precise time. The indicator is available on various trading platforms free of cost. The indicator offers quickest technical analysis to enable the intraday traders to make faster decisions. As said above, it is extremely simple to use and understand.
However, the indicator is not appropriate for all situations. It works when the market is trending. Hence it is best to use for short-term technical analysis. Supertrend uses only the two parameters of ATR and multiplier which are not sufficient under certain conditions to predict the accurate direction of the market.
Supertrend Indicator Formula and Trading Strategy
Basically, supertrend indicator is a wonderful tool to know the current market trends. It clearly depicts the distinction between downtrends and uptrends.
The supertrend indicator calculation goes as stated below-
Up = (high + low / 2 + multiplier x ATR
Down = (high + low) / 2 – multiplier x ATR
Calculation of Average True Range –
[(Prior ATR x 13) + Current TR] / 14
Here, 14 indicates a period. Hence, the ATR is derived by multiplying the previous ATR with 13. Add the latest TR and divide it by period.
Thus, ATR plays an important role in the supertrend technical analysis indicator.
Identifying Buy and Sell Signals
Understanding and identifying buying and selling signals in supertrend is the main crux for intraday traders. Both the downtrends as well uptrends are represented by the tool. The flipping of the indicator over the closing price indicates a signal. A buy signal is indicated in green colour whereas sell signal is given as the indicator turns red. A sell signal occurs when it closes above the price.
Check the given charts and see the sell signals shown with the red colored arrows. You also see how you can trace your stop loss using this indicator and save your profits.
There are many certified technical analysis courses available at reputed share market training institutes. Newbies can learn to use indicators and technical analysis of the markets right from zero.
Conclusion
NTA® is not using supertrend indicator though. But we are educating our learners to use the indicator and to form the right trading strategy while using it. As a part of our advanced share market training course, we familiarize students with the indicator and train them to use it.
We also reiterate that no technical analysis tool is totally accurate and so we say it for supertrend too. Yet it helps you to make smart decisions and earn handsome profits. There are times when you get false signals which are yet again not as high as compared to other indicators. Hence, it is best to use the right combination of multiple indicators.