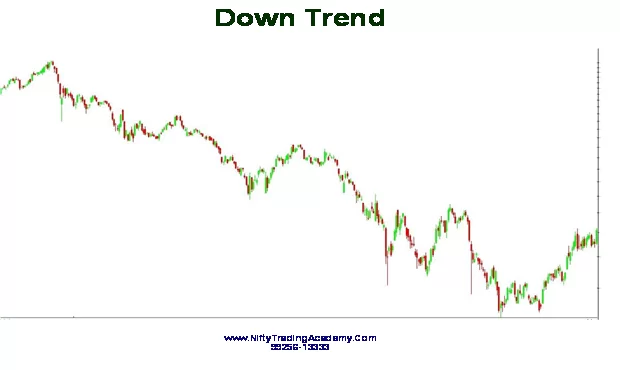
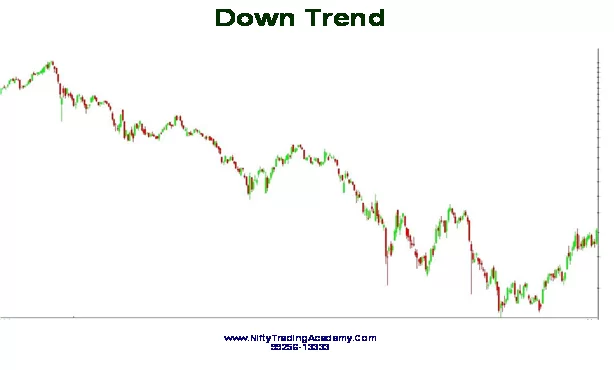
The definition of Market Trend can be expressed as the tendency of the prices in moving towards a particular direction, increase or decrease,at a given period. It is very important for a trader to identify the market trends so that he can capture the price movements in future and can act accordingly. He has to rely on technical analysis to find out the right market trend. Generally, this trend with regard to the price movements is divided into two categories. One is ‘Up Trend’ and the other is ‘Down Trend’. Traders identify the Up Trend by ‘Higher Highs’and ‘Lower Lows’. Equally, the down trend is identified by ‘Lower Highs’ and ‘Lower Lows’. Down Trend is the mirror image of Up Trend.

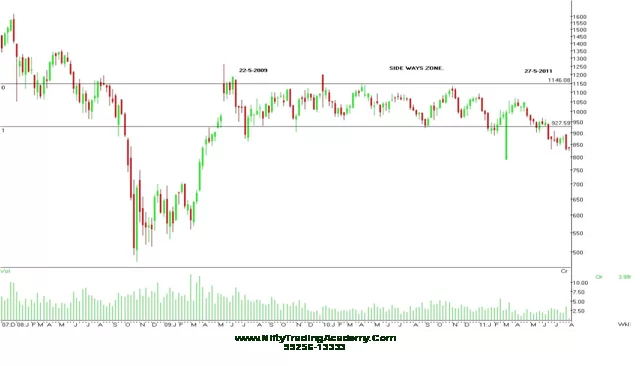
Keep in mind that only 30% to 40% of the time people can come across a clear trend.Remaining 70% to 60% time is known as the Trading Market or Sideways Market. It is wise not to trade in this trading phases because it is a sure way to meet with loss. This clearly shows the importance of keeping oneself with the trading trends.

With regard to time frame, this market trend can be categorized into three different types such as Short Term Trend, Medium Term Trend and Long Term Trend. Short term trend may exist from less than one day minimum to five days maximum. Medium term trend may remain from few weeks to few months. Lastly, Long Term Trend may be from several weeks to several months.

This much important trend can be identified using different methods.
Trend Line: This is the most important tool employed in finding the market trend. Two or more number of price points connected to form a straight line is the trend line since this indicates the current market position. Further, when it gets exceeded into the future period, it is capable of indicating supports or resistances for a particular stock.The strength of a trend line reflected by its support or resistance level depends on the number of price points it attracts.
Also read: How to Read Stock Charts for Day Trading
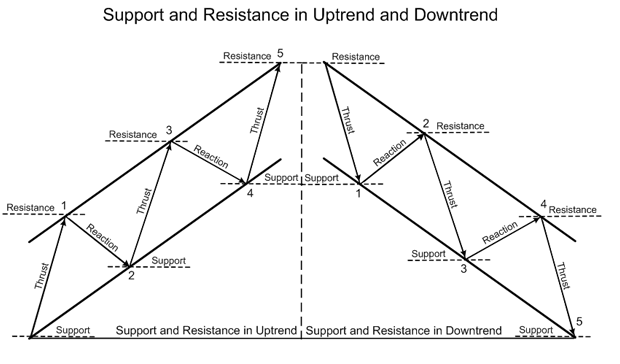
The more the price points are there in the trend line, the support or resistance level will be more powerful.Traders or investors call this as ‘Up Trend Line’ when it has up slope. This happens when the later low is higher than the previous low, which is a positive position. This positive slope is treated as support level. When stocks are purchased by buyers with a strong determination,the situation is bullish and is reflected on the trend line showing rising price points along with rising volume.


On the other hand, ‘Down Trend Line’ occurs when it has negative or down slope. This happens when the later high is lower than the previous high, which is a negative position. This negative slope is treated as resistance level. When stocks are sold by sellers with a strong determination, the situation is bearish and is reflected on the trend line showing declining price points along with rising volume.
Note: In order to get desired result,effective trend line combined with inner trend line sufficiently supported by proper angle is very important. We help our students improvise on this art of drawing effective and valid trend line by providing all possible techniques.
Another important aspect in Trading is Volume. Trading volume means the number of shares traded within a given period. For example, Trader A purchased 50 shares from Trader B. Hence, the total volume traded is 50. Some newbiemay mistakenly consider it as 100. In a chart, it is plotted as the histogram depicting the interest level of buying or selling. Sometimes, a particular stock is traded with high volume or with high trading interest, which is considered as ‘Liquid Stock’. This means lots of people are ready to buy or sell that particular stock. Again, volume analysis helps to determine the strength or weakness of price moves. Traders are likely in to react positively with the strong moves and avoid weak moves. These are some general ideas to do profitable trading.
Rising price together with rising volume will create a perfect strong move. When a trader buys a share, he will look for rising numbers and certain amount of eagerness which will further push the price higher. Suppose the price increases and the volume decreases, and then it clearly shows lack of interest. This is a warning sign for potential reversal. To state this in simple terms low volume either with price decline or rise is not at all a good sign.
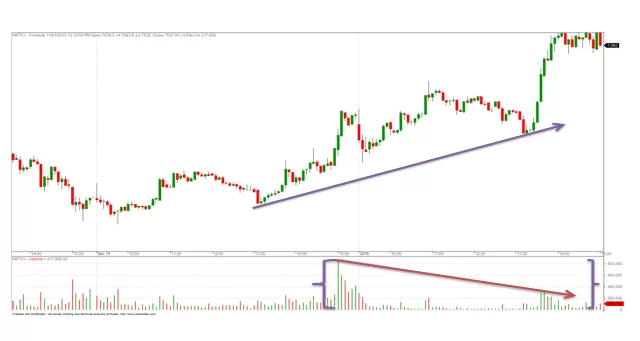

Sometimes extraordinary volume does not always support the move.

Two most important aspects required for successful trading are support and resistance. These are very simple in trading but are very powerful. People quite often overlook these simple factors and concentrate on complex aspects like F&O Data. However, in reality most experienced and top level trader pays due interest to these two aspects because, it is true that these are main key factors for the success in trading. Before going further, let us define Support and Resistance separately.
Support is equal to Demand and resistance is equal to Supply. The reason for their importance is that it is only due to the imbalance of supply and demand, price moves occur. In case, these two factors are balanced there will be no price move. Price will stop its down move and reverse when support/demand is below the current price. Likewise, advancement of price will stop its move and reverse when resistance/supply is above the current price.
Lesson 3 - What are Moving Averages and their Different Types
Start Your Share Market Course Here: Share Market Training Course
Start Your Share Market Course Here: Technical Analysis Training