One of the popular methods of trading among the technical traders is ‘trading with bands’. By plotting the high and low of a particular Moving Average, ‘bands’ are created. This is done with the help of standard deviations of MA. The simple trading rule of MAC is as follows: buy when price closes above MAC and short sell when price closes below MAC.
This band is a powerful tool that measures volatility.It has a moving average plotted as the middle band. Above and below of this MA, two standard deviations of this MA are further plotted. When the volatility increases, the bands automatically widen and when the volatility decreases these bands narrow.
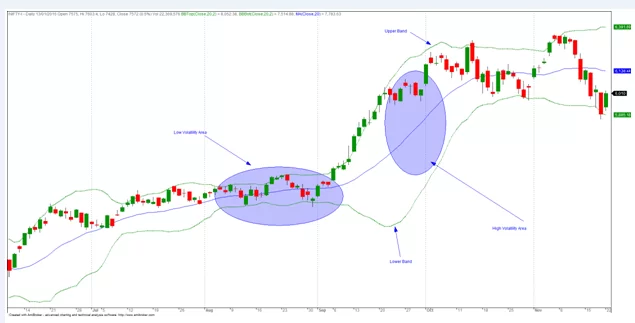
Keep in mind that volatility must increase after a low volatility period; and likewise after a high volatility period it must decrease.
We teach our students how to use Bollinger bands and the various strategies involved to do successful trading.
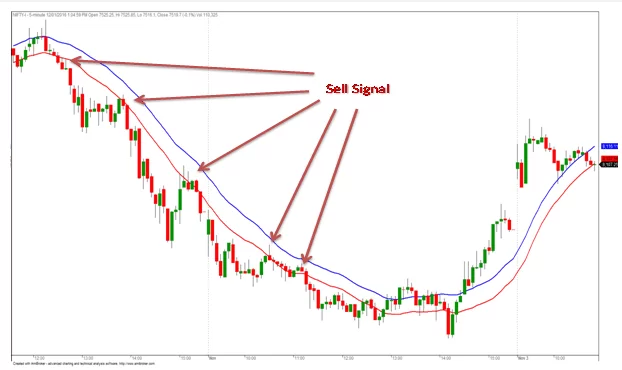
Chester Keltner wrote a book called ‘How to Make Money in Commodities’ in 1960. In that original version, he has introduced “Ten-Day Moving Average Trading Rule”.This rule begins with the centerline that has 10-day SMA with its typical price {(H+L+C/3)}. To set the upper and lower channel lines the 10-day SMA that includes High-Low range has to be added and subtracted.
The modified version of this rule is introduced by Linda Bradford Raschke in 1980, which uses Average True range. To set channel width, ATR technique introduced by LBR is used. The channels have two ATR values which are placed above and below the exponential moving average or EMA that indicates channel width. This is a trend following indicator. It enables reversals along with channel breakouts. In addition, oversold and overbought levels can be identified.
When we study deeply, we come across two major differences between these Bollinger and Keltner Channels. They are:
Explore our Free Technical Analysis Library Now!
Nifty Trading Academy can help you to learning advance technical analysis like Bollinger Bands Intraday Trading, Keltner Bands trading, Bands Parameter, Bands strategy, Bands stock chart, double bolinger bands and also learn how do you calculate bands.
Start Your Trading Education: Online Share Market Training Course
Improve Your Technical Analysis: Best Technical Analysis Training