Trend lines, one of the trading tools, are the most amazing thing used by successful traders. Traders who avoid indicators also are favorite users of trend lines. Experienced traders can easily assess the way trend lines interact with price action even without drawing them. John Hills’s Trend Line theory will explain how you can join with those traders.
Ultimate Trading Guide is one of the best trading books co-authored by John Hill. This book contains the Yum-Yum Continuation Pattern, which I reviewed. Another not so popular book of john hill is ‘Scientific Interpretation of Bar Charts’. A chapter is devoted specially for his ‘Trend Line Theory’ in this book.
In this chapter, John Hill has introduced different types of trend line breakout setups. The purpose of these breakout setups is to find out the validity of these break out suing the following:
1 - Trend
2 - Swing retracement percentage
3 - Number of pullback swings
4 - Relative swing length
This review contains the use of trend lines so that it helps to find pullback trades that are found in Trend Line Theory.
Usually, when a pullback is weak, traders will assume the trend will resume.Hence, risking of the valuable trading capital is worthy for a weak pullback. At the same time, strong pullbacks are clues for the very fast reversing market. Traders using pullbacks must hold the reins intelligently.
Complex pullbacks and their strengths are observed by the two simple trend lines.
Initially, you have to learn the way to draw the 0-2 and 0-4 lines. In a bull trend, point 0 is considered as the extreme high of a trend. Downward pullback begins from that point on wards.
Start labeling from points 0 to 4 by referring the diagram mentioned below.
Afterwards, if you connect points from 0 to 2, you will get your 0-2 line, which is green.
Finally, if you connect the points from 0 to 4 you will get your 0-4 line, which is red.

These are examples for bullish market and the same logic can be applied to bearish market. You can very well practice drawing equivalent diagram of a bearish trend for an exercise and verify your final conclusion against trading rules mentioned below.
It is very much suitable for an intermediate indicator period in order to trade deeper pullbacks. So, this example 50-period SMA (the orange one) is used to check the trend.
Price swings are marked in Blue so that anchors and their trend lines are highlighted.
LEARN – How to Read Stock Charts for Price and Volume
You can find that the short position is profitable and the MCD is continuously in the downwards trend.
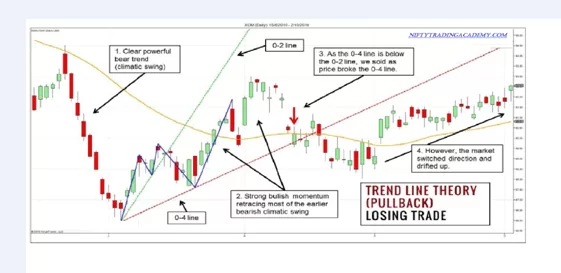
This is an example of losing position. There is the clear warning given by the deep retracement of the pullback. Keep in mind that deep pullbacks may turn out to be a reversal in disguise.
This strategy impresses me a lot since this is the cleverest way of utilizing trend lines. In order to enjoy a reliable pullback setup, you need to concentrate on the trend context.
This setup of trend line usage does more than judging the simple breakouts or the market bias. The combination of two [0-2 and 0-4] trend lines makes it easy to judge the pullback strength.
Swing pivots are part of trend lines on which they hang on. Swing pivots and the different methods of marking them affect the slope of the resulting rend lines. This is because of the confusion in marking them.
Take the above example where I have used only basic pivots. Whatever method you use to mark the points, you must stick on with that all through you’re trading.
Among these various methods, waiting for a definite trend line break is the safe entry method. This means you need to wait till the bar gets close above or below the trend line. However, this method has a risk factor. You may miss the profitable and swift breaks.
On the whole, ‘Scientific Interpretation of bar Charts’ by John Hill contains lots of complex ideas regarding price action. It must be studied in detail by all price action traders.
Grow Your Technical knowledge Now with : Stock Market Technical Analysis Course