
Trading Indicators are beneficial tools that are used by most of the traders. Most Accurate Intraday Trading Indicators are used with the different Intraday Trading Setup. This post will help you to gain knowledge about the Technical Indicators and their use.
Why Need Intraday Trading Indicators?
For Technical Analysis, you should first know about the Indicators and where to apply them. All these Technical Indicators helps the intraday trader to analyze the price movement with the timing of the stock.
In technical language Indicators are independent trading systems introduced by the successful traders which are built on back-tested on their technical study to arrive at a trading decision? It helps to make decisions for buying and selling, confirming trends and also for predicting trends.
These trading Indicators are useful for
- To know the direction of the current market trend
- Momentum in the investment market
- Demand and supply trading theory
- Volume assessment to know the popularity of the market
- Take decisions about entry and exit
- The crux is to find the right mix of indicators for the perfect decisions. Always use the best combination of indicators for day trading.
List of Top 5 Most Active Intraday Trading Indicators
Here is the list of most used and active Indicators that are used by most of the traders.
- Moving Average
- Relative Strength Index
- MACD
- ADX
- ATR
1. Moving Average (M.A):
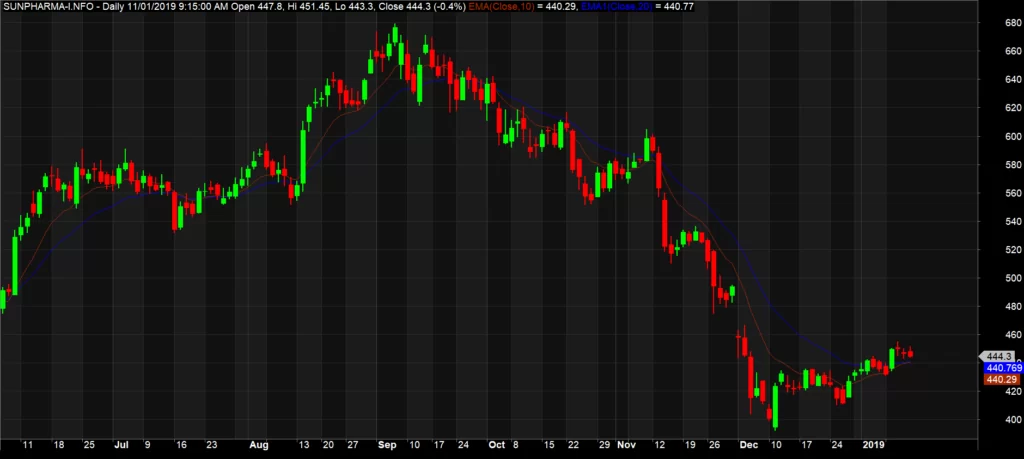
Moving Average is the trend indicator and it is mostly used because it is very simple to use and it gives more effectiveness. In the technical analysis moving average is calculated based on the average of closing price. i.e. The 5 days of moving average of a particular stock is calculated by the total of 5 days closing price / 5.
Application of Moving Average: Most common application of moving average is to identify the trend direction, and to determine the support and resistance levels.
Most commonly used moving averages are:
Simple Moving Average (SMA) – It is the simple average of a security over a defined number of time period.
Exponential Moving Average (EMA) – It gives greater weight to more recent data points hence most traders prefer the use of EMA instead of SMA.
- Moving Averages can be calculated in any time frame from minutes to hours to months and years.
2. Relative Strength Index
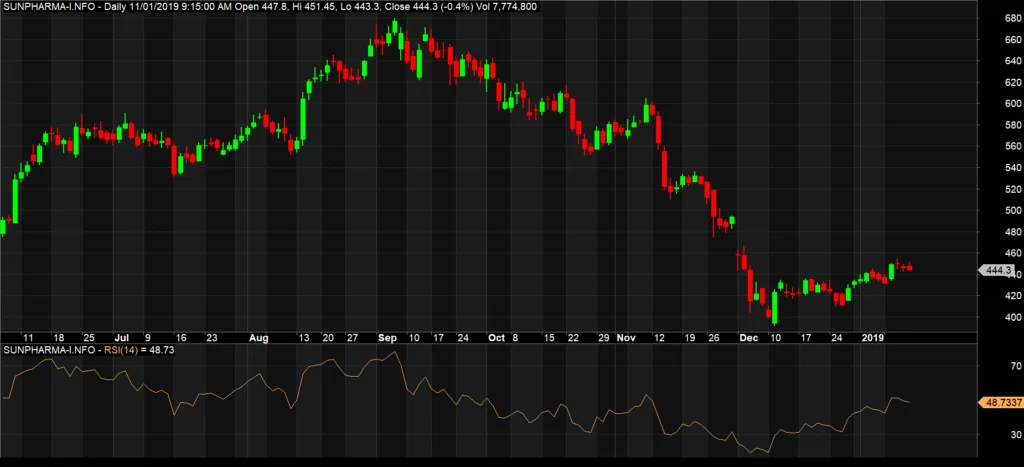
- RSI is a momentum oscillator, developed by J. Welles Wilder that measures the change of price movements.
- RSI oscillates between 0 and 100.
- This Indicator generates signals for overbought when above 70 and oversold when below 30.
- RSI can also be used to identify the general trend.
- In 1978, RSI mentor Andrew Cardwell introduced positive and negative reversals for RSI.
Calculation of Relative Strength index – RSIThe Relative Strength Index (RSI) is a two-part calculation that starts with the following formula:
RSI (Step One) = 100 – [ 100 / 1 + Ave Gain / Ave Loss]
The average gain or loss used in the calculation is the average percentage gain or loss during a back period. The standard uses 14 periods to calculate the initial RSI Value.
The traditional interpretation and usage of the RSI values of 70 or above indicate that a security is becoming overbought and it’s reading of 30 or below indicates an oversold.
3. MACD (Moving Average Convergence/Divergence Oscillator)
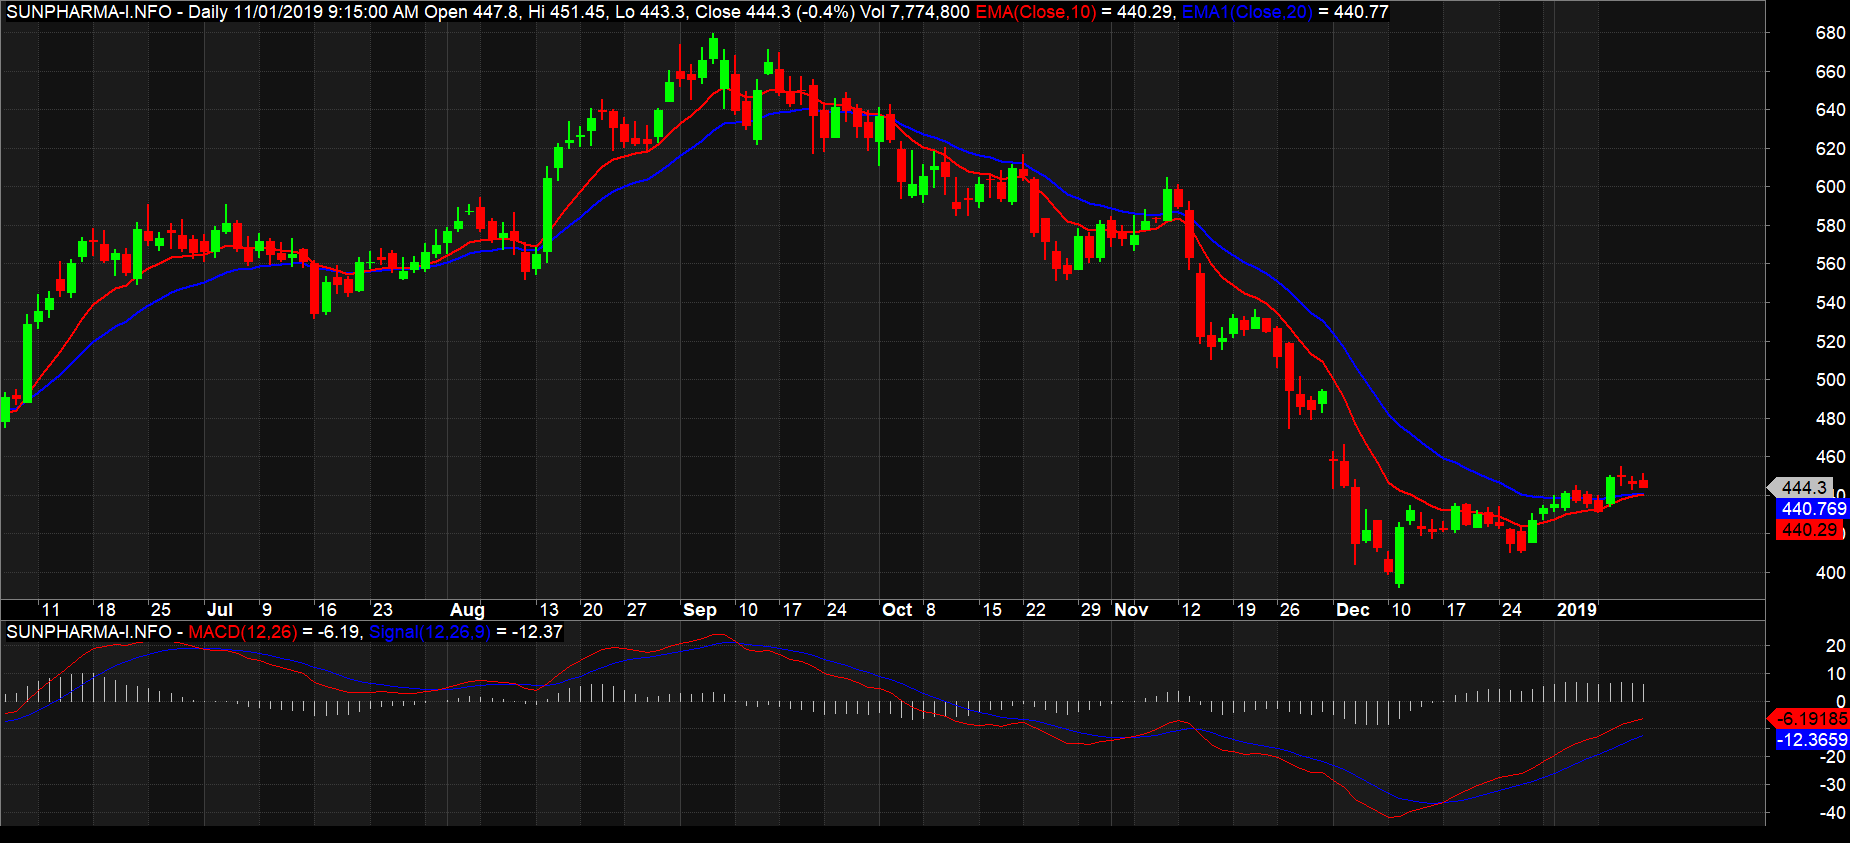
MACD is a Versatile tool developed by Gerald Appel. It is a trend following momentum indicator. It shows the relationship between two moving averages of Price of security. MACD turns two trend-following indicators, Moving Average into a momentum oscillator by subtracting the longer moving average from the shorter moving average.
MACD fluctuates below and above the zero lines as the moving averages cross, Converge, and diverge.
The default parameter of MACD is 12,26 and 9. A 9-day EMA of the MACD Line plotted with the indicator is a signal line and it Identifies turns. The MACD Histogram represents the difference between MACD and its 9- day EMA, the signal Line. The Histogram is positive when the MACD Line is above its Signal Line and negative when the MACD Line below its Signal Line.
4. ADX (Average Directional Index)
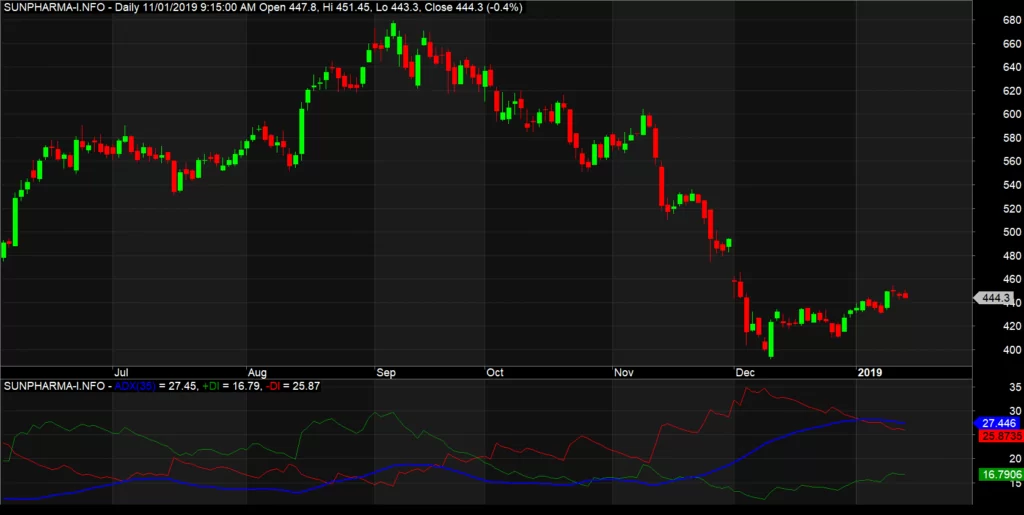
ADX is the indicator that is used to quantify trend strength. Calculation of ADX is based on Moving Average of price range expansion over a given period of time.
The Default Setting is 14 bars. The Typical Interpretation is that if ADX is above 25, the market is trending. If ADX is below 25, the market is in a downtrend.
ADX is non- directional and it registers trend strength whether the price is trending up or down. This Indicator is plotted as a single line with values ranging from a low of zero to a high of 100.
5. ATR (Average True Range)
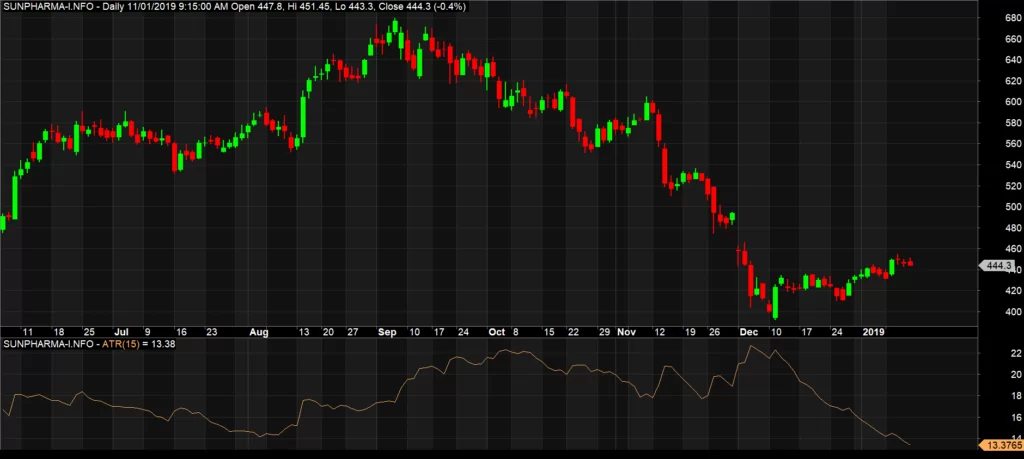
Average True Range is a technical analysis indicator that measures volatility was developed by J. Welles Wilder. He originally developed ATR for Commodities, but it is used by most of the traders for stock and Indices.
Calculation
By default, the average True Range is based on 14 Periods and can be Calculated on a min to min, daily, weekly or monthly basis time frame.
Daily data can be calculated by the following formula:
Current ATR = [(Prior ATR × 13) + Current TR] / 14
Prior ATR = Multiply the previous 14- day ATR by 13.
- Interpretation of ATR is Subjective. There is no level that indicates a stock is about to take reversal.
Recommended For Intraday Trader : Best Intraday Trading Tips