What is Stock Market Analysis?
A Stock market analysis can be defined as an attempt to predict future market actions or to provide a general insight into the market. There are mainly two types of stock market analysis that include many concepts and factors which are to be considered when performing analysis on the stock market.
Types of Stock Market Analysis
#1. Fundamental Analysis
- Main objective of fundamental analysis is to determine whether a company’s future value is accurately reflected in its current stock price.
- A fundament analyst looks at the company’s market share, financial records, assets, the quality of its management, products and other data specific to a company/ or a market sector when analysing stock market.
- For the selection of the stock using fundamental analyst also uses revenues, earnings, future growth, return on equity, profit margins, and other data to determine a company’s underlaying value and potential for future growth.
- It determines the health and performance of an underlaying company by looking at key numbers and economic indicators.
- The purpose of this analysis is to identify fundamentally strong companies or industries and fundamentally weak companies or industries.
#2. Technical Analysis
- Technical analyst performs stock market analysis by looking at the market trends and movement of the market. They make decisions about buying and selling of stocks using the market statistics.
- Technical analysis involves the study of charts (i.e. candlestick charts)
- There are many factors that are considered and analyse by analyst while selecting the stocks such as support and resistance level, strategies based on back testing of the charts, other indicators such as RSI, moving average, etc., as per the requirements of the trader.
- Technical analysis states that historical price and trends of the stocks are repeat overtime. On the basis of the past studies analysist pick stocks.
Popular Technical Analysis Indicator
There are number of Indicators available for the technical analysis of the stock market. Find here an easy way to understand the most popular indicators.
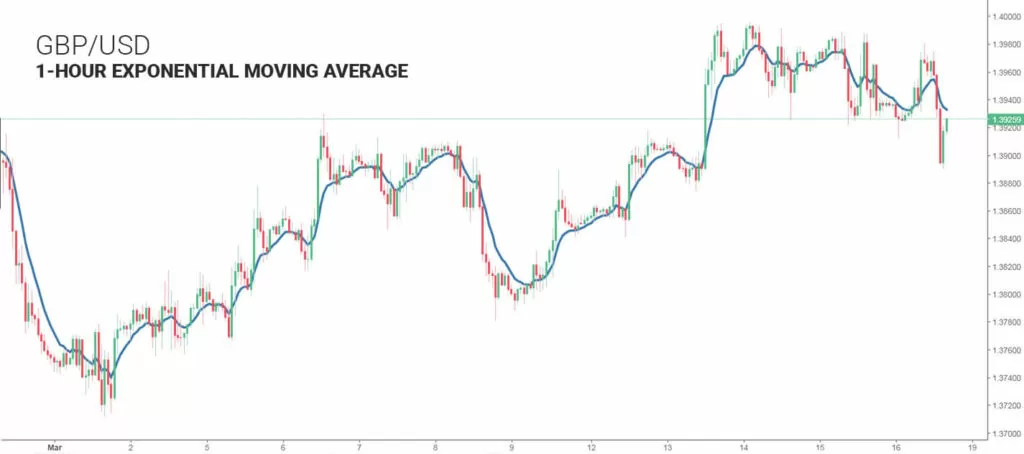
#1. Moving Average (M.A)
Moving Average is a widely used indicator, that helps analyst to find out trend.
Use of M.A
- To know the reversal of trend
- To find out the stop loss and trailing stop loss.
- To find out the price over extended
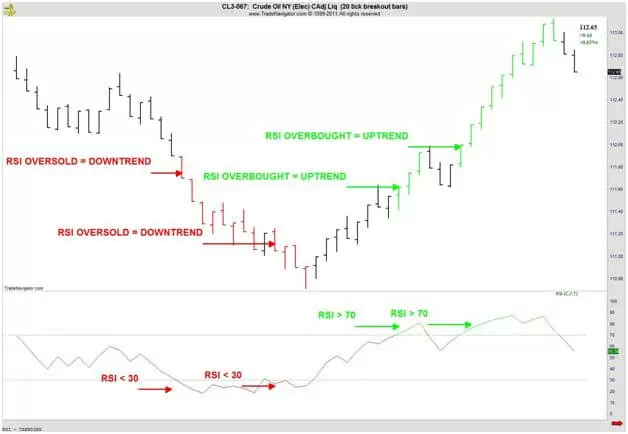
#2. Relative Strength Index (RSI)
- RSI shows over sold and over bought signals. When RSI touches 70, selling the stock is good & vice versa, buying is good when RSI goes below 30.
- This indicator is known as Momentum Indicator.
- RSI indicates that the price is oversold or overbought.
- It also compares the price between Advancing period and decline period.
- The commonly used parameter is 14 period.
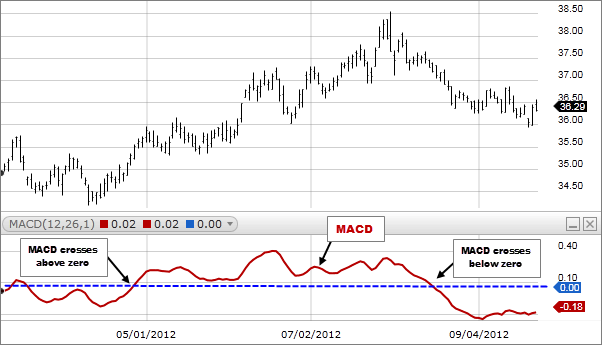
#3. Moving Average Convergence Divergence (MACD)
- MACD is use for identifying the different aspects of overall trend. These aspects are momentum, trend direction and duration.
- The MACD fluctuates above and below the zero line as the moving averages converge, cross and divergence.
- Analyst look for signal line crossover, Centreline crossovers and divergence to generate signals.
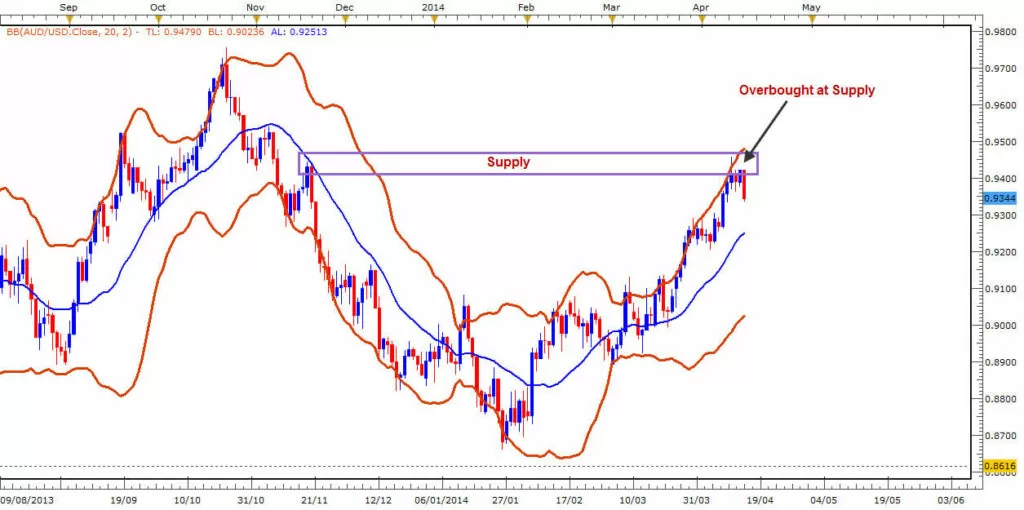
#4. Bollinger Bands (B-Bands):
- Bollinger Bands are volatility bands that placed above and below a moving average.
- The band may be at high or low.
- It uses Band Bollinger Demand and Supply Zones.
- Analyst make buy decision as per demand zone with lower band touching the price at support same as sell in Supply zone with higher band touching the price at Resistance.
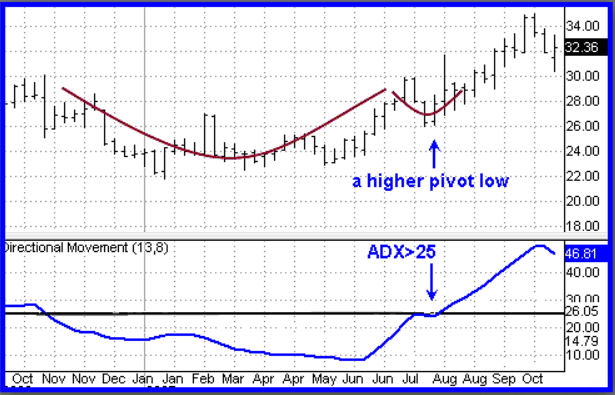
#5. Average Directional Index (ADX)
- ADX is used to quantify the strength of the trend. Calculation of ADX are based on a moving average of price range expansion over a given period of time.
- Default setting is 14 bars
- It is momentum indicator.
- Below 10 to 15 indicator the consolidation.
- > 25 reading indicates the strength.