
Candlestick gives information about how price moves and behaves. The candles provide four prices. The Open, High P, Low and Close Price.
The specific Candle refers to that information for a specific time. For a Daily time frame, each candle gives the information of daily price action and gives the info of the open, high, low, close price for that particular day. Similarly, for the different time frames, the candle conveys price movement information with respect to that particular time period. From the below image, you can see that there are two types of candles.

The colour of the candle is also useful for understanding whether the open price was higher or lower than the close price.
If the candle is green this means that the open price is below the close price and it is denoted as a bullish candle, and on the opposite candle, the red candle is denoted as a bearish candle, as the open price is above close price.
So, here is the basic understanding of candles. Now let’s learn the most powerful candlestick patterns that can be used for trading.
5 Best Candlestick Patterns
#1 Doji
The Doji has almost zero or zero range between its open and close price, which indicates that there are neither buyers nor sellers are fully in control. As you can see in the image there are four types of Doji.
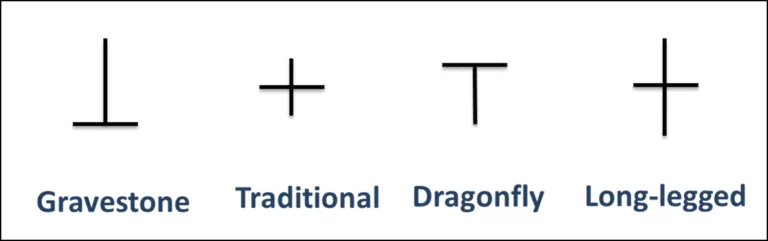
A “long-legged doji” has long shadow in both directions that shows that there is balanced pressure from both buyers and sellers. The “dragonfly” and “gravestone” doji indicates that buyers and seller controlled the market for most of the trading session.
#2 Hammer
A hammer is a candle stick pattern with a small body (a small range from open to close price), and a long shadow below the body and little wick above the body.
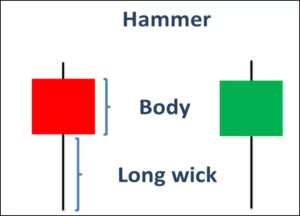
When a hammer appears at the bottom of a downtrend, it indicates that there is an unsuccessful effort by sellers to push the price down, and corresponding effort buyers to push price back up quickly before the session closed.
When a hammer candlestick appears at the bottom of the downtrend suggests the potential reversal of trend and start of the bullish trend. To confirm the hammer’s reversal signal, the next candle should close above the high of the hammer candle.
#3 Checkmate
Checkmates occur when price moves in a narrow trading range preceding a reversal in direction. In a bullish checkmate at a support level, price trade in a small range, as you can see in the image.
In a bearish checkmate, an uptrend reaches to a resistance level that is tested and then rejected due to consequent pressure from sellers.

When the price breaks the narrow trading range, and close above this range confirms the reversal in trend.
#4 Tweezer
This pattern is a two-candlestick reversal pattern that appears as either the tops or bottoms of trends. From the below image you can see that both candlesticks share either a high or low, but represent movements in opposite market directions.
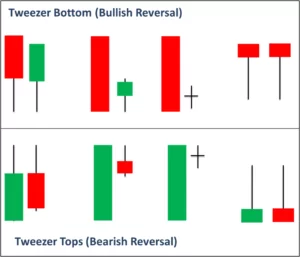
Tweezers pattern indicates that once price reached a significant level (i.e. top or bottom level), there was a transfer of dominance between bulls and bears.
#5 Kicker
A kicker pattern, also known as a professional gap, it occurs when the following conditions are satisfied:

- There is a strong trend. Price should move in a trend.
- When Gap occurs suddenly, it indicates that the open price of a candle is not equal to the close price of the previous candle; there is a gap in the movement of price.
- For the kicker pattern, the gap should occur in the opposite direction of the trend.
Note: The information provided in this blog is for education purposes only. Before you trade using the charting patterns, you should know about the risk of loss and how to manage the risk. NTA® is not responsible for any kind of profit or loss.