
- Every trader who is either a beginner in the field of the stock market or an experienced one has always heard about the candlestick chart.
- Candlestick chart was developed by Munehisa Homma, who happens to be a rice trader in the 18th century in Japan.
- This chart is considered to be one of the most basic price charts that is used in the stock market for technical analysis.
How does a candlestick chart work?
- A candlestick chart is used by the traders to determine when to enter as well as exit the market.
- This chart will depict the highs and lows of security for a specific period of time.
- This chart is also considered to be a crucial component of technical analysis.
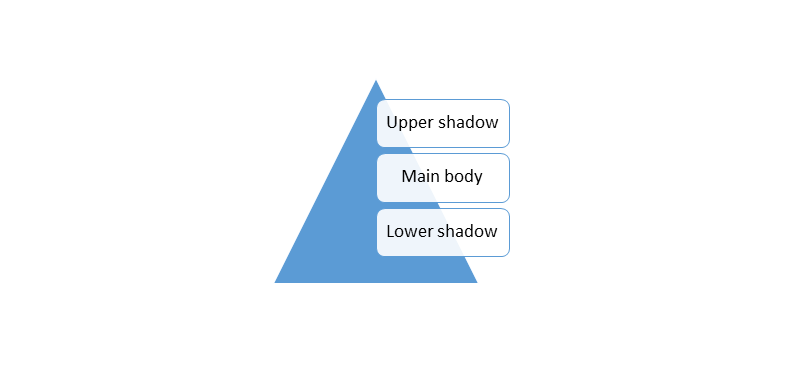
A candlestick chart has three components
- The main body of the candlestick chart will specify whether the closing price was higher or lower than the opening price.
- It could be black or red in the case of lower and white or green in the case of higher.
- The shape of the candlestick shadow will represent the fluctuation in the price of the security throughout the day from opening to closing time.
Significance of the candlestick chart
- In a candlestick chart, the white or green candle will indicate that there is strong buying pressure, or you can say that the market is bullish.
- A black or red candlestick chart will point towards significant selling pressure, which will also indicate that the market is bearish.
- As mentioned earlier, a candlestick will show the price movement for a specific time period.
- This time period can be anything from ten minutes to a few hours as per the wish of the trader.
- Traders should keep in mind that the candlestick chart should be looked at in the context of the overall market structure.
- Here, any number of factors can affect the securities as well as their respective prices.
- This will make the candlestick chart one of the best factors for risk management.
Types of the candlestick chart patterns
- There are several candlestick chart patterns that you will come across in your study of technical analysis as well as fundamental analysis.
- This will also help you when you start creating your own trading strategy.
Some of the common types of candlestick chart patterns are as follows:
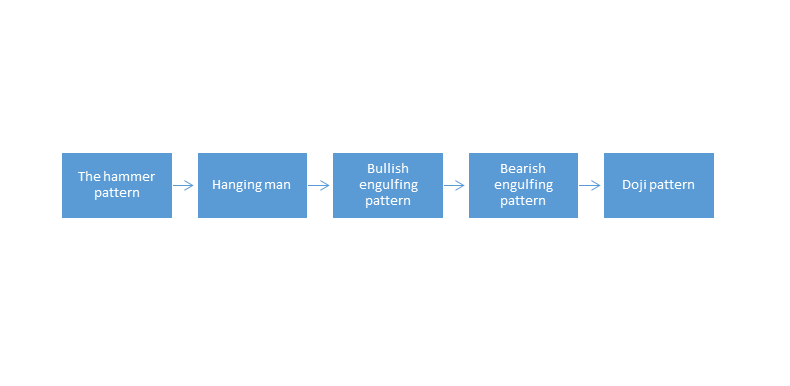
The hammer pattern
- This is a reversal pattern.
- A hammer is supposed to contain a small body as well as a long lower shadow.
- This will occur at the bottom of the trend.
- Almost no upper shadow in the hammer pattern exists.
Hanging man
- It is a single candlestick pattern that will occur at the top of the uptrend.
- A candlestick pattern is considered to be a hanging man only if it precedes an uptrend.
- The bearish hanging man will indicate selling pressure at very high levels.
Bullish engulfing pattern
- This is a double candlestick pattern that will indicate trend reversal in the favor of the buyer.
- This is a pattern that will form when a red candlestick is followed and is overtaken by a large green candlestick.
Bearish engulfing pattern
- This is a double candlestick pattern that will indicate a trend reversal in the favor of the seller.
- This is a pattern that will form when a green candlestick is followed and is overtaken by a large red candlestick.
Doji pattern
- This pattern will take the shape of a plus sign.
- The open price is almost equal to the closing price, with only a slight difference between the two.
- This is highly indicative of the indecision in the stock market.
Conclusion
The above-mentioned are the most commonly used candlestick charts for better success in the stock market.
Frequently Asked Questions (FAQs)
Q1) What is a candlestick chart?
A candlestick chart is a graphical representation used in the financial analysis so as to display the price movement of an asset.
Q2) Who introduced the candlestick chart?
Munehisa Homma introduced the candlestick chart.
Q3) What is the most powerful candlestick pattern?
The most powerful candlestick pattern is the one that is often regarded as the hammer or bullish or the shooting star (bearish) pattern.
Q4) What is the theory of the candlestick?
If the candlestick has a long body, then it will indicate a significant increase in the price by showing strong buying pressure.
Q5) What is a candlestick?
A candlestick is a device that is used to hold a candle in place.
About Us
Nifty Trading Academy is our academy where we teach you about the stock market as well as technical analysis. We also provide live market support and upload blogs for the same.