
The Hull Moving Average is an advanced technical indicator that has gained popularity among investors due to its unique approach to smoothing out prices.
What is the Hull Moving Average?

- Hull Moving Average (HMA) is a refined moving average indicator that is designed to address the limitations of traditional moving averages such as simple moving averages (SMA) and exponential moving averages (EMA).
- This indicator was developed by Alan Hull to provide a smooth and more responsive representation of price trends, enhance security, and reduce lag.
Advantages and disadvantages of using HMA
Using the hull indicator has its own advantages and disadvantages.
The following are the main advantages of HMA

The main disadvantages of HMA are as follows

Working of Hull Moving Average
- HMA operates by utilizing weighted calculations and a root mean square approach.
- This combination will help to eliminate the lags that are often associated with other moving averages.
- It will also place great emphasis on recent price movements while still incorporating historical data.
- This will also offer a clear picture of the current market trend.
Hull Moving Average Calculation
HMA is calculated using the following steps:
Step 1: Calculate a simple moving average (SMA) with the specified periods.
Step 2: Calculate a weighted moving average (WMA) with the same periods but with a weighting period that will increase exponentially as the price of the data gets closer to the present.
Step 3: Calculate the difference between SMA and WMA.
Step 4: Smooth out the difference between SMA and WMA using a third WMA with the help of a weighing factor that is inversely proportional to the square root of periods.
The formula for calculating HMA is as follows:
HMA= WMA( SMA( price, n), k),
Where,
HMA= Hull Moving Average
WMA= Weighted Moving Average
SMA= Simple Moving Average
N= number of periods
K= weighting factor
The weighting factor is calculated using the following formula:
K= 2/ (sqrt(n) + 1)
HMA can also be calculated using any spreadsheet software or any trading platform.
There are several online calculators available so you can use them as well.
Also Read: What is Pledging and What are Its Benefits?
How does HMA calculation reduce lag?
The HMA calculation will reduce lag in the following ways:
- The weighting factor that is used to calculate HMA increases exponentially as the price data gets closer to the present. This will mean that the more recent price values will get more weight, which means that HMA will be more responsive to the change in prices.
- The smoothing factor that is used to calculate HMA is inversely proportional to the square root of the number of periods. This will mean that the HMA is smoothed more heavily for shorter periods and less heavily for more extended periods, thereby reducing the noise in the data and making the HMA easier to interpret.
Due to this, HMA can calculate and track price movements more closely than other traditional moving averages.
Using the HMA strategy
You can use HMA for the following strategies:

Trend-following strategy:
- This strategy indicates buying the stock when the HMA crosses the support level and selling when the stock crosses below the resistance level.
Divergence strategy:
- It involves looking for divergences between HMA and price action.
- A bullish variation will occur when the price hits lower lows but HMA hits higher lows.
- This signal will indicate that the trend is about to reverse to the upside.
- A bearish variation will occur when the price is higher but the HMA is low, and this trend will indicate a reverse to the downside.
Filter strategy:
- This involves using the HMA to filter out the noise in the market and identify the most suitable viral trends.
- The best HMA for you will only depend on your trading style and your risk tolerance.
Interpretation of the Hull Moving Average Strategy
The following are the main ways to interpret the HMA:
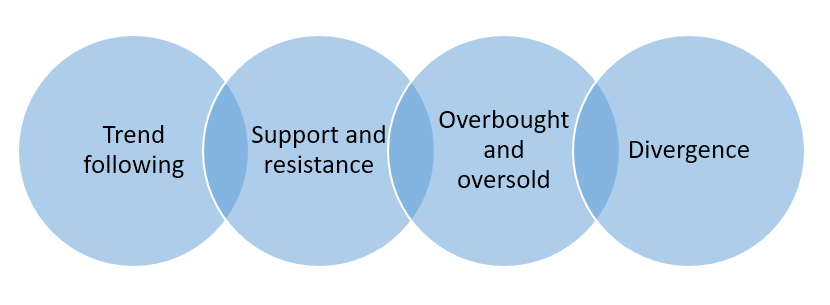
Trend following:
- It is used to identify trends by looking for the direction of the HMA; a rising HMA will indicate an uptrend, whereas a falling HMA will depict a downtrend.
Support and resistance:
- HMA will identify these levels by looking for the areas where HMA has previously bounced off.
Overbought and oversold:
- This condition can be identified by looking for areas where HMA has exceeded or fallen below a certain level.
Divergence:
- The divergence between HMA and the price action will be taken into consideration.
Drawbacks of the Hull Moving Average:
The main drawbacks of HMA are as follows:

Conclusion:
HMA is a powerful tool for traders to seek a more responsive as well as accurate indicator of market trends.
Frequently Asked Questions (FAQs):
Q1. What is the full form of HMA?
The full form of HMA is the hull moving average.
Q2. Which is better, EMA or HMA?
HMA generates 30% more profitable trades than SMA or EMA.
Q3. What is the best HMA?
The best HMA, as detected by Alan Hull, is a period of 16.
Q4. Which trading strategy is most successful?
The buy-and-hold strategy is the most successful trading strategy.
Q5. Is there a 100% trading strategy?
There is no trading strategy that guarantees 100% trading profit, and that too without risk.
About Us:
Nifty Trading Academy is an academy that uploads blogs about the stock market, along with technical analysis. We also provide online or offline classes to enhance our knowledge of the stock market.